|
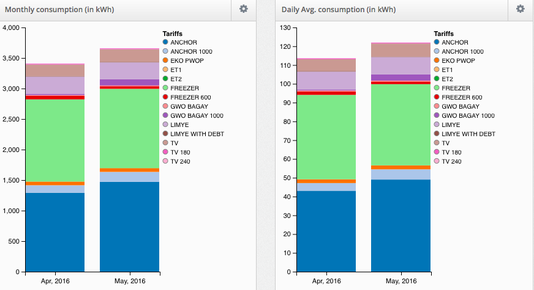
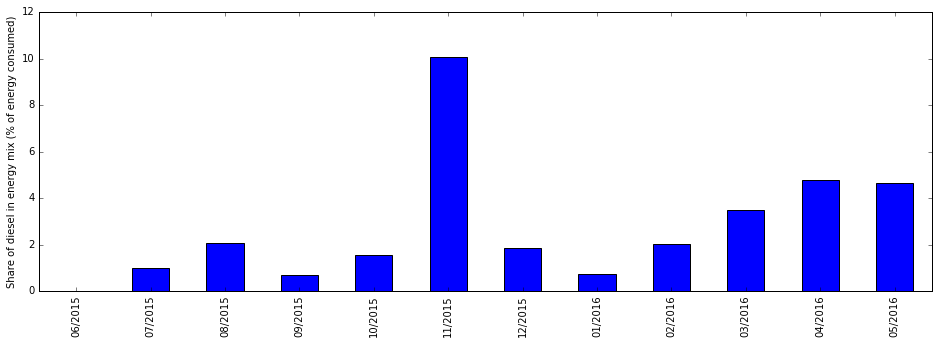
By Arthur Jacquiau-Chamski With a year of grid operations in Les Anglais, we’ve been able to gather some pretty cool data on how the grid is working through the use of smart meters developed by EarthSpark's first technology spin-off, SparkMeter! Below, you can see the average monthly consumption per household by service level. (Remember that EarthSpark offers different service levels to different customers based on their needs and their ability to pay for service. 'Limyè' service, for example, offers basic lighting and phone charging. The "Gwo Bagay" service level translates directly as "Big Things" in English and powers small businesses beyond the power needed for simple cooling and freezing. As a comparison, consider the fact that US average monthly consumption was 911 kWh per month in 2014. Down below you can see the past two months' monthly and daily data straight from SparkMeter's cloud interface. Below we have the share of diesel in the energy consumed each month. As you can see, the highest percentage of diesel was in November and only represented about 10% of the grid's total energy for that month. The diesel generator is most needed when there is high demand or low sunshine, so early winter and/or rain may explain higher generator use. Part of the allure of pre-pay electricity is that customers can pay for electricity as their household energy budget allows - electricity can be sold in small increments just like kerosene. Now we have the numbers on energy transactions. What we see is that:
This is just some of the data we are able to see from SparkMeter and our generation logs that helps us understand our customers energy habits and helps us run an efficient, sustainable service.
0 Comments
Your comment will be posted after it is approved.
Leave a Reply. |
EarthSpark supporters make our work possible. Thank you for considering a donation towards eliminating energy poverty in Haiti.
Read the full blog - click here!
|
EarthSpark International is a non-profit 501(c)3 organization.


